
Reading Financials: A Practical Guide
Introduction: Why Financials Matter
Whether you’re an investor, small business owner, or aspiring CFO, learning how to read financials is a vital skill. Financial statements tell a story about a company—its health, risks, and potential. With accurate financial statement and analysis, you can make better business decisions, assess company performance, and avoid major surprises.
Are you confident your business tax filings are fully optimized and compliant?
The Three Core Financial Statements
Income Statement
Also called the profit and loss statement, this shows revenues, expenses, and profit over a specific accounting period—usually quarterly or annually. It reflects a company’s ability to generate profit and manage costs efficiently. Key line items include:
- Revenue: The total income from sales of goods or services.
- Cost of Goods Sold (COGS): Direct costs tied to production.
- Operating Expenses: Salaries, rent, marketing, etc.
- Taxes and Interest: Expenses not directly tied to core operations.
- Net Income: The bottom line—what’s left after all expenses.
Balance Sheet
A snapshot of a company’s financial standing at a single point in time. It answers the question: what does the company own and owe?
- Assets: Resources the business owns. Divided into:
- Current (cash, accounts receivable, inventory)
- Non-current (machinery, real estate, patents)
- Liabilities: Obligations the company must pay.
- Current (due within a year)
- Long-term (mortgages, bonds)
- Equity: Shareholders’ residual interest in assets after liabilities.
Cash Flow Statement
Summarizes cash inflows and outflows during a period. It’s crucial for understanding how well a company manages its cash.
- Operating Activities: Day-to-day business operations
- Investing Activities: Buying or selling assets, investments
- Financing Activities: Loans, dividends, share issuance
Helps answer: Is the company actually generating cash, or just booking paper profits?
How to Read Financials Step-by-Step

- Start with the Income Statement – Look at trends in revenue, COGS, and profit margins. Is the company becoming more or less profitable?
- Check the Balance Sheet – Identify leverage and liquidity. What are the debt-to-equity and current ratio values? Is the company over-leveraged or holding excessive inventory?
- Review the Cash Flow Statement – Does cash from operations cover expenses and debt repayments? Are there heavy outflows from investing?
- Use Vertical Analysis – See what percentage of revenue is eaten by COGS or spent on operations. This shows cost control efficiency.
- Use Horizontal Analysis – Compare financials over multiple periods to detect improvements or warning signs like revenue stagnation or declining profits.
Pro Tip: Always compare with industry averages or benchmarks to contextualize the numbers.
Financial Analysis of Financial Statements
Vertical vs. Horizontal Analysis
- Vertical Analysis simplifies complex financial statements by expressing each item as a percentage of a base figure. For income statements, it’s usually revenue; for balance sheets, total assets.
- Horizontal Analysis tracks the change in each item over time. A sudden spike in expenses or a drop in assets raises flags.
| Metric | Year 1 | Year 2 | % Change |
| Revenue | $100,000 | $120,000 | +20% |
| COGS | $60,000 | $72,000 | +20% |
| Net Profit | $10,000 | $14,000 | +40% |
This tells us that while revenue and costs grew equally, profit grew disproportionately—a good sign of improved efficiency.
Common-Size Statements
Used to compare businesses of different sizes. Each item is shown as a percentage of a key figure, allowing apples-to-apples comparisons.
Example: If Company A and Company B both make $1M in revenue but have different expense profiles, a common-size income statement will quickly show which manages costs better.
Key Financial Ratios and What They Reveal
These ratios transform raw data into actionable insight.
Liquidity Ratios:
- Current Ratio = Current Assets / Current Liabilities. Measures ability to meet short-term obligations.
- Quick Ratio = (Cash + Accounts Receivable) / Current Liabilities. Excludes inventory for a stricter view of liquidity.
Profitability Ratios:
- Gross Margin = (Revenue – COGS) / Revenue. Higher is better.
- Operating Margin = Operating Income / Revenue. Measures core efficiency.
- Net Margin = Net Profit / Revenue. Reflects overall profitability.
Leverage Ratios:
- Debt to Equity = Total Debt / Total Equity. Higher values indicate more financial risk.
- Interest Coverage = EBIT / Interest Expense. Shows ability to service debt.
Efficiency Ratios:
- Inventory Turnover, Accounts Receivable Turnover, and Asset Turnover highlight how effectively resources are used.
Real-Life Financial Data Example
Imagine a mid-sized retailer operating in Ontario:
- Revenue: $500,000
- COGS: $300,000
- Gross Profit: $200,000
- Operating Expenses: $120,000
- Net Profit: $80,000
Now add context:
- Gross Margin = 40% (solid for retail)
- Net Margin = 16% (above average)
- Current Ratio = 2.5 (healthy liquidity)
- Debt to Equity = 0.6 (low leverage)
Insights:
- The business controls costs well (low overhead).
- It likely isn’t over-reliant on debt.
- Strong margins suggest pricing power or operational efficiency.
Use this structure as a template to analyze financial performance of other businesses.
How Financial Analysts Use FS Analysis
Financial analysts rely on:
- Comparing performance against peers
- Modeling future cash flows
- Recommending investment decisions
- Flagging solvency and liquidity issues
They use tools like Excel, financial modeling software, and dashboards.
Financial Reporting vs. Financial Analysis
Let’s break down the difference:
Financial Reporting is:
| Financial Analysis is:
|
Think of it this way: reporting tells what happened; analysis explains why it happened and what to do next.
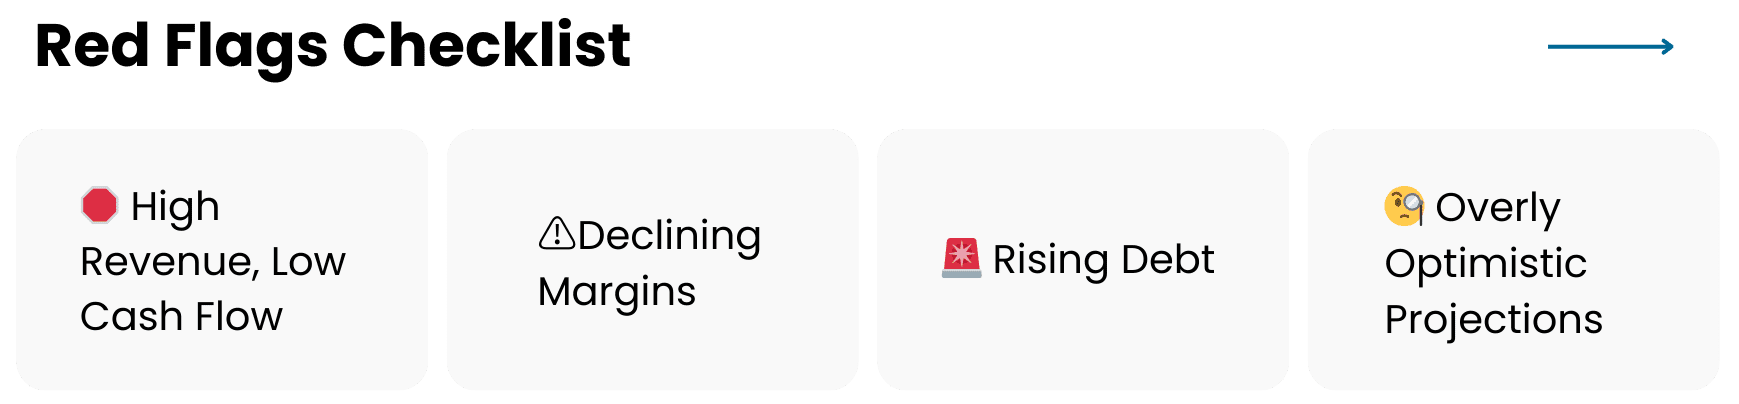
Red Flags and Pitfalls to Watch For
Identifying warning signs can help avoid bad investments or operational issues.
- High revenue, low cash flow – Could signal aggressive revenue recognition.
- Declining margins – Suggests rising costs or poor pricing power.
- Rising debt without asset growth – A sign of unhealthy financing.
- Frequent write-offs or restatements – Indicates poor financial controls.
- Low interest coverage – Can mean trouble meeting debt obligations.
- Overly optimistic projections – Cross-verify with past performance.
Conclusion: Analyzing a Company with Confidence
Learning how to read financials isn’t just for accountants. It empowers entrepreneurs, investors, and team leaders to make better choices. The goal isn’t to memorize every term but to confidently spot trends, risks, and opportunities in financial information.
Whether you’re doing a financial analysis of financial statements or reviewing quarterly updates, understanding these basics brings clarity to chaos.
Want help analyzing your company’s numbers? Talk to a financial analyst today.
Frequently Asked Questions
What’s the easiest way to start reading financial statements if I’m not from a finance background?
Start with the income statement—it’s the most intuitive. Look for trends in revenue, expenses, and profit over time. Then move on to the balance sheet to understand what the company owns (assets) and owes (liabilities). Finally, review the cash flow statement to see how much actual cash is flowing in and out. Don’t worry about ratios at first. Just try to understand the business story behind the numbers.
Tip: Use real companies’ public filings (like Apple or Shopify) as practice material. Sites like EDGAR (U.S.) or SEDAR+ (Canada) publish them for free.
What are common mistakes people make when analyzing a financial statement?
Here are five common mistakes:
- Focusing only on net income: A company might look profitable but have poor cash flow.
- Ignoring footnotes: Financial statements often hide key info (like pending lawsuits or lease obligations) in the notes.
- Not comparing across periods: Always analyze trends, not just one year in isolation.
- Forgetting to benchmark: Numbers are meaningless without comparison—use industry averages.
- Over-relying on one ratio: No single metric tells the whole story. Use a combination of liquidity, profitability, and leverage ratios for context.
How can I tell if a company is financially healthy?
There’s no single answer, but here are key markers:
- Positive and consistent cash flow from operations
- Sustainable profit margins (not just one-time windfalls)
- A healthy current ratio (1.5–2.5 is generally good)
- Low debt-to-equity (especially for companies with cyclical revenue)
- Strong interest coverage (ability to service debt)
Also, management commentary in annual reports often provides clues. A cautious tone, vague future outlooks, or constant “one-off” charges are red flags.
What financial ratios are most important for small businesses?
Small businesses should track:
- Current Ratio – for short-term stability
- Gross Profit Margin – to measure product profitability
- Net Profit Margin – to see how much actually turns into profit
- Accounts Receivable Turnover – to check how quickly you’re getting paid
- Debt to Equity – to monitor financial risk
For service-based businesses, operating expenses matter more than COGS. For product-based ones, COGS and inventory turnover are key.
Is financial analysis useful for startups?
Yes—especially for early-stage investors, founders, and CFOs. Even if a startup isn’t profitable, financial forecasting, cash runway analysis, and burn rate help track viability.
Look at:
- Monthly recurring revenue (MRR)
- Gross margins
- Churn rate (for SaaS)
- Break-even analysis
- Unit economics
Plus, investor pitches often demand a working knowledge of financial reporting and financial statement analysis.
What’s the difference between accounting and financial analysis?
- Accounting is about recording and organizing numbers—what happened.
- Financial analysis is about interpreting those numbers—why it happened and what it means.
Accounting follows strict rules (like IFRS or GAAP), while analysis is flexible and depends on your goals—investing, budgeting, or strategy.
How do I analyze a company’s financial health over time?
Use horizontal analysis. This shows the year-on-year percentage changes in key metrics like revenue, expenses, or net profit. Then add vertical analysis to understand cost structure (e.g., what % of revenue goes to rent or salaries).
Also:
- Compare at least 3 years of data
- Calculate growth rates
- Check if expenses are scaling slower than revenue
- Monitor balance sheet strength (liquidity, leverage)
Combined, these tools help you analyze a company beyond the surface.
Are audited statements more reliable?
Yes. Audited financials are reviewed by independent CPAs to confirm accuracy and adherence to accounting standards. That said, audit quality varies by firm and region. While audits reduce the risk of fraud or misreporting, they don’t eliminate it.
Pro tip: Always read the audit opinion letter. If it includes terms like “qualified” or “going concern,” investigate further.
How often should I review financial statements?
- Small business owners: Monthly (at least)
- Investors: Quarterly earnings reports
- Managers: Monthly operational reviews + quarterly strategic check-ins
- Lenders/analysts: Depends on credit cycle or review periods
Consistency matters more than frequency. Regular reviews help spot problems early—like shrinking margins, rising receivables, or unsustainable debt.
Key References
- Investopedia: Financial Statement Analysis
- Corporate Finance Institute: Analysis of Financial Statements
- Bench: How to Read Financial Statements
- Harvard Business Review: Financial Intelligence
- U.S. Securities and Exchange Commission (SEC): Beginner’s Guide to Financial Statements